Top Posts
S&P 500 on the Verge of 6,000: What’s...
Clusters of Long Winning Streaks: What They’re Telling...
Three Charts Showing Proper Moving Average Alignment
Should You Invest in Silver Bullion?
Justin Huhn: Uranium Game On — Supply “Mirage,”...
US Capital Global Facilitates $50MM Financing to Accelerate...
Shein and Temu see U.S. demand plunge as...
Strategic Chaos or Tactical Goldmine? What QQQ’s Chart...
Why ADX Can Mislead You — And How...
S&P 500 on the Verge of 6,000: What’s...
  • Home
  • Investing
  • Stock
  • Economy
  • Editor’s Pick
Market Commandos
Economy

S&P 500 and Nasdaq: New Targets and Support Levels

by admin October 19, 2024
October 19, 2024

S&P 500 and Nasdaq: New Targets and Support Levels

  • During this morning’s Asian trading session, the S&P 500 finds support at the 5840.0 level
  • The Nasdaq gained new support this morning at the 20200.0 level

S&P 500 chart analysis

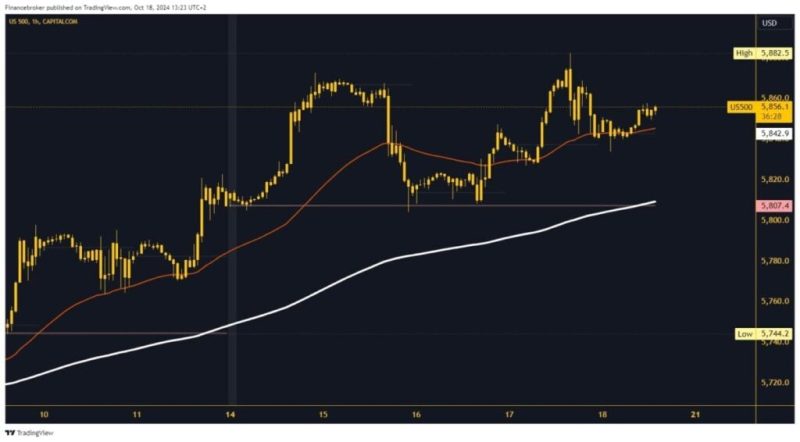
During this morning’s Asian trading session, the S&P 500 finds support at the 5840.0 level. Additional support in that zone is the EMA 50 moving average, which influenced the index to remain stable. In the EU session, we climbed up to $5860.0, and we expect a continuation of the bullish side in the US session. On Thursday, October 17, the S&P 500 created a new all-time high at 5882.5. We managed to break above the previous high from Monday, October 14.

All signs indicate that we can expect a continuation of the bullish consolidation. Potential higher targets are 5880.0 and 5900.0 levels. If the current bullish momentum decreases, the S&P 500 could turn to the bearish side. After that, we will see a pullback below the 5840.0 level and the EMA 50 moving average. Since we lost the previous support, we must continue the retreat and look for a new one at lower levels. Potential lower targets are 5820.0 and 5800.0 levels.


Nasdaq chart analysis

The Nasdaq gained new support this morning at the 20200.0 level. With the support of the EMA 200 moving average, we quickly moved back above the weekly open level to the positive side and continued to the daily high at 20315.0. The index at 20250.0 forms a higher low and thus confirms determination for further recovery to the bullish side. Potential higher targets are 20350.0 and 20400.0 levels.

If there is a reduction in the bullish momentum again, the Nasdaq will have to start a new pullback. We are again forced to test the weekly open level and the support of the EMA 200 moving average. This time, we need a break of the index below to a new daily low as a confirmation of bearish momentum. Potential lower targets are 20150.0 and 20100.0 levels. This week’s Nasdaq low was at 20042.0.


The post S&P 500 and Nasdaq: New Targets and Support Levels appeared first on FinanceBrokerage.

previous post
Interactive Brokers Expands Crypto Services in 2024
next post
Amazon makes first foray into live news with election night special hosted by Brian Williams

You may also like

Oil Prices Rebound After Trump’s Criticism of Powell

April 22, 2025

Trump’s Fed Criticism Sparks Investor Concerns

April 22, 2025

Buy Bitcoin Under $100K Before The Next Bull...

April 22, 2025

Gold Price Surge Hits $3,385 Amid Trade Tensions

April 21, 2025

Fed’s Stagflation Warning Impacts Crypto Markets

April 21, 2025

BNB Price Surge Leads Crypto Gains as Bitcoin...

April 21, 2025

Stock Market News UK Update: FTSE 100 &...

April 20, 2025

Stock Market News UK Update: FTSE 100 &...

April 19, 2025

Stock Market News UK Update: FTSE 100 &...

April 18, 2025

Stock Market News UK Update: FTSE 100 &...

April 17, 2025

    Stay updated with the latest news, exclusive offers, and special promotions. Sign up now and be the first to know! As a member, you'll receive curated content, insider tips, and invitations to exclusive events. Don't miss out on being part of something special.


    By opting in you agree to receive emails from us and our affiliates. Your information is secure and your privacy is protected.

    Recent Posts

    • S&P 500 on the Verge of 6,000: What’s at Stake?

      June 6, 2025
    • Clusters of Long Winning Streaks: What They’re Telling Us

      June 6, 2025
    • Three Charts Showing Proper Moving Average Alignment

      June 6, 2025
    • Should You Invest in Silver Bullion?

      June 6, 2025
    • Justin Huhn: Uranium Game On — Supply “Mirage,” De-risked Demand, Next Price Move

      June 6, 2025
    • About us
    • Contact us
    • Privacy Policy
    • Terms & Conditions

    Copyright © 2024 MarketCommandos.com All Rights Reserved.

    Market Commandos
    • Investing
    • Stock
    • Economy
    • Editor’s Pick