Top Posts
Run Your Stock Portfolio Like a Pro Sports...
Leadership Rotation Could Confirm Corrective Phase
Breakouts, Momentum & Moving Averages: 10 Must-See Stock...
Appeals Court Grants Trump Temporary Reprieve on Tariffs,...
Top 5 Canadian Mining Stocks This Week: Adyton...
NVIDIA Rallies After Strong Q1, AI Demand Outshines...
U.S. foreign tax bill sends jitters across Wall...
Analyzing SIL, USO, and NVDA: Could These Bullish...
Nuclear Power Trio: OKLO, SMR, and CCJ in...
Charbone Hydrogene annonce les resultats financiers T1 2025
  • Home
  • Investing
  • Stock
  • Economy
  • Editor’s Pick
Market Commandos
Economy

S&P 500 and Nasdaq: S&P 500 has resistance at 5860.0 zone

by admin October 23, 2024
October 23, 2024

S&P 500 and Nasdaq: S&P 500 has resistance at 5860.0 zone

  • The EMA 200 moving average proved to be excellent support for the S&P 500 index on Tuesday, October 22
  • Nasdaq managed to climb to a new weekly high at 20455.8 level

S&P 500 chart analysis

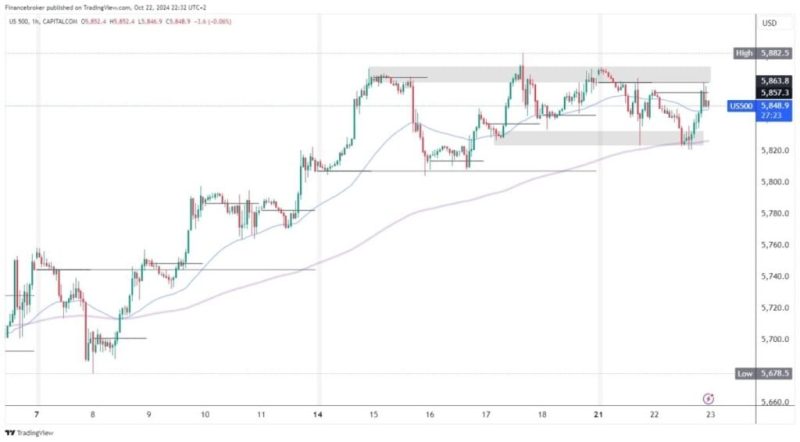
The EMA 200 moving average proved to be excellent support for the S&P 500 index on Tuesday, October 22. After support at the 5820.0 level, we saw the initiation of a bullish consolidation back to the daily open level of 5857.3. We even tested the weekly open level of 5863.8 but failed to hold on to that zone. The index again turned to the bearish side and retreated to 5845.0 levels. Here, we test the EMA 500 moving average.

Potential lower targets are 5840.0 and 5830.0 levels. If we get support from the EMA 50 moving average, the S&P 500 has a new opportunity to return above the daily open level and test today’s resistance in the 5865.0 zone. We need to stay there for further recovery on the bullish side. Potential higher targets are 5870.0 and 5880.0 levels.


Nasdaq chart analysis

Nasdaq managed to climb to a new weekly high at 20455.8 level. After three days, the index broke the resistance at the 20400.0 level. Although we did not stay above for long, the breakout is a good indicator that the Nasdaq has pretensions to move back to the bullish side. Potential higher targets are 20475.0 and 20500.0 levels.

For a bearish option, we need a pullback below the 20300.0 level. With that step, the index moves below the weekly open level to the negative side. After that, pressure builds for a further pullback to 20250.0 and the EMA 200 moving average. This week, the moving average managed to hold the price above on the positive side and produce a bullish consolidation in the previous two cases. This time, we hope for a breakout below and a new daily low formation. Potential lower targets are 20225.0 and 20000.0 levels.


The post S&P 500 and Nasdaq: S&P 500 has resistance at 5860.0 zone appeared first on FinanceBrokerage.

previous post
ApeCoin and Akita Inu: pullback continues to new weekly lows
next post
Amazon to shut down speedy brick-and-mortar delivery service

You may also like

Oil Prices Rebound After Trump’s Criticism of Powell

April 22, 2025

Trump’s Fed Criticism Sparks Investor Concerns

April 22, 2025

Buy Bitcoin Under $100K Before The Next Bull...

April 22, 2025

Gold Price Surge Hits $3,385 Amid Trade Tensions

April 21, 2025

Fed’s Stagflation Warning Impacts Crypto Markets

April 21, 2025

BNB Price Surge Leads Crypto Gains as Bitcoin...

April 21, 2025

Stock Market News UK Update: FTSE 100 &...

April 20, 2025

Stock Market News UK Update: FTSE 100 &...

April 19, 2025

Stock Market News UK Update: FTSE 100 &...

April 18, 2025

Stock Market News UK Update: FTSE 100 &...

April 17, 2025

    Stay updated with the latest news, exclusive offers, and special promotions. Sign up now and be the first to know! As a member, you'll receive curated content, insider tips, and invitations to exclusive events. Don't miss out on being part of something special.


    By opting in you agree to receive emails from us and our affiliates. Your information is secure and your privacy is protected.

    Recent Posts

    • Run Your Stock Portfolio Like a Pro Sports Team

      May 31, 2025
    • Leadership Rotation Could Confirm Corrective Phase

      May 31, 2025
    • Breakouts, Momentum & Moving Averages: 10 Must-See Stock Charts Right Now

      May 31, 2025
    • Appeals Court Grants Trump Temporary Reprieve on Tariffs, “TACO” Taunts Gain Steam

      May 31, 2025
    • Top 5 Canadian Mining Stocks This Week: Adyton Sparkles with 97 Percent Gain

      May 31, 2025
    • About us
    • Contact us
    • Privacy Policy
    • Terms & Conditions

    Copyright © 2024 MarketCommandos.com All Rights Reserved.

    Market Commandos
    • Investing
    • Stock
    • Economy
    • Editor’s Pick