Top Posts
Three Charts to Watch for an “All Clear”...
Use This Multi-Timeframe MACD Signal for Precision Trades
The Unpredictable Stock Market: How to Make Sense...
Group Eleven Intersects 12.0m of 2.30% Cu and...
Los Andes Copper at 121 Mining Investment London
Bold Ventures to Present at Metals Investor Forum...
Judge allows lawsuit over Burger King’s Whopper ads...
AMD CEO calls China a ‘large opportunity’ and...
NBA star Russell Westbrook launches AI-enabled funeral planning...
Will Trump’s Foreign Film Tariffs Crush Streaming Stocks?...
  • Home
  • Investing
  • Stock
  • Economy
  • Editor’s Pick
Market Commandos
Economy

Bitcoin & Ethereum: Sharp Fall on Oct 31, Potential Selling

by admin November 3, 2024
November 3, 2024

Overall Analysis

  1. Bitcoin fell sharply on 31st Oct from higher levels, indicating profit booking, and missed a time high of just 300 points. The selling trend might go long. 
  2. Ethereum continued respecting levels from higher time frames and fell sharply in the 31st Oct trading session. The price might break major support levels, triggering massive selling.

Bitcoin Chart Analysis

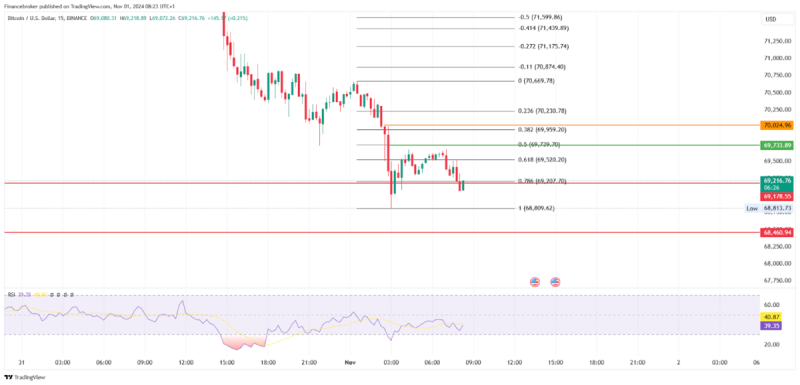
BTC/USD 15-Minute Chart (Source: TradingView)

On the 31st Oct 2024 trading session, bitcoin fell sharply from a higher level, respecting all the resistance areas. Price missed to create an all-time high just from 300 points.  

After a huge distribution phase, which lasted nearly two days, the price showed profit booking, and buyers were not interested in taking the price higher as the price waited near the resistance zone for days, but after the breakout, it didn’t reach an all-time high, losing the buyers’ trust. 

Currently, looking at the price, we can see it is sharply coming down, simultaneously creating lower lows and lower highs. 

The seller can plan an entry based on the swing golden ratio rejection or break the $69,178 level for the targets of $68,460 and $67,554, with the stop loss around the $70,024 level. 

Please note: adjust stop loss according to your trading plan, as in such a fast market price comes for stop loss hunting. 

Ethereum Chart Analysis

ETH/USD 15-Minute Chart (Source: TradingView)

On the 31st Oct 2024 trading session Ethereum broke the supporting trendline and sharp selling triggered.

Ethereum price moment syncs with Bitcoin, as the price is coming down in lower low and lower high patterns. Both cryptos made similar swings and continued their rally downwards. Ethereum, on a higher time frame, is stuck in a channel, continuing to respect the level for a long time.

Currently, the price has come down rapidly, only allowing a selling position. Taking a buying position in this market will not suit trading psychology and money management.

To create a selling position, plan an entry if the price breaks $2,490, targeting $2,468 and $2,434, with a stop loss near the $2,530 level.

If the price exceeds $2,400, a significant trend will break, leading to substantial selling or a rapid reversal. Short a position with a small stop loss and a trailing stop loss.

The post Bitcoin & Ethereum: Sharp Fall on Oct 31, Potential Selling appeared first on FinanceBrokerage.

previous post
Election-Related Market Swings: How to Stay Ahead
next post
Marc Benioff is in talks to sell Time to Antenna Group

You may also like

Buy Bitcoin Under $100K Before The Next Bull...

April 22, 2025

Oil Prices Rebound After Trump’s Criticism of Powell

April 22, 2025

Trump’s Fed Criticism Sparks Investor Concerns

April 22, 2025

Gold Price Surge Hits $3,385 Amid Trade Tensions

April 21, 2025

Fed’s Stagflation Warning Impacts Crypto Markets

April 21, 2025

BNB Price Surge Leads Crypto Gains as Bitcoin...

April 21, 2025

Stock Market News UK Update: FTSE 100 &...

April 20, 2025

Stock Market News UK Update: FTSE 100 &...

April 19, 2025

Stock Market News UK Update: FTSE 100 &...

April 18, 2025

Stock Market News UK Update: FTSE 100 &...

April 17, 2025

    Stay updated with the latest news, exclusive offers, and special promotions. Sign up now and be the first to know! As a member, you'll receive curated content, insider tips, and invitations to exclusive events. Don't miss out on being part of something special.


    By opting in you agree to receive emails from us and our affiliates. Your information is secure and your privacy is protected.

    Recent Posts

    • Three Charts to Watch for an “All Clear” Signal

      May 8, 2025
    • Use This Multi-Timeframe MACD Signal for Precision Trades

      May 8, 2025
    • The Unpredictable Stock Market: How to Make Sense of It

      May 8, 2025
    • Group Eleven Intersects 12.0m of 2.30% Cu and 560 g/t Ag, Including 6.4m of 3.72% Cu and 838 g/t Ag, Demonstrating High-Grade Copper and Silver Potential at Ballywire

      May 8, 2025
    • Los Andes Copper at 121 Mining Investment London

      May 8, 2025
    • About us
    • Contact us
    • Privacy Policy
    • Terms & Conditions

    Copyright © 2024 MarketCommandos.com All Rights Reserved.

    Market Commandos
    • Investing
    • Stock
    • Economy
    • Editor’s Pick