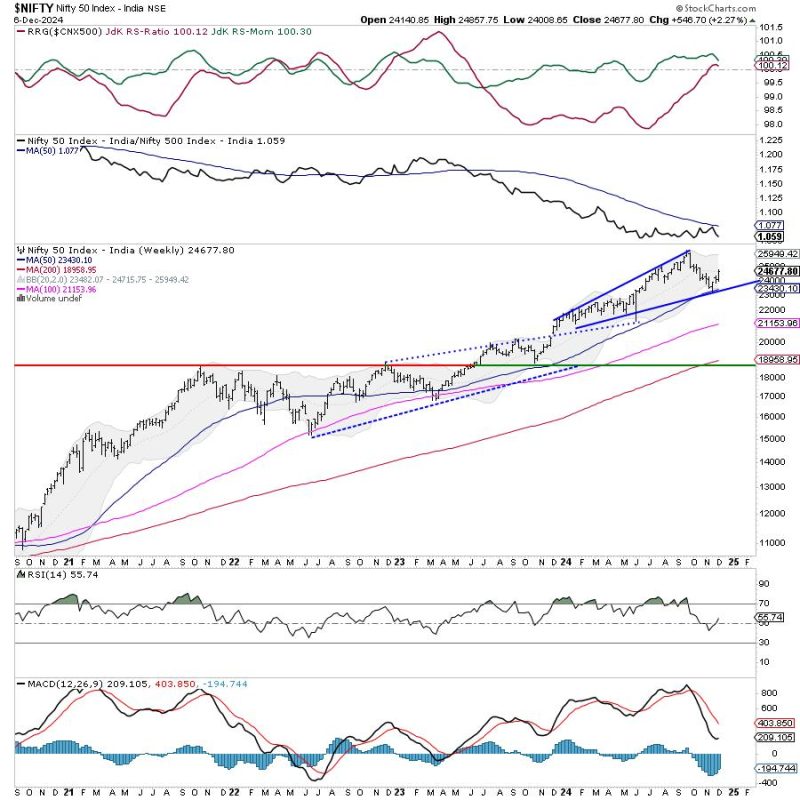
The markets closed with gains for the third week in a row as the key indices posted gains while extending their technical rebound. The Nifty had a trending week; it trended higher most of the week. The volatility was largely absent, but the Indices stayed quite choppy on most days except the last day, where it remained flat. The volatility stayed largely subdued; the India VIX retraced by 1.98% to 14.14 on a weekly note. The trading range stayed wider; the Nifty oscillated in an 849-point range over the past five sessions. The headline index finally closed with a net weekly gain of 546.70 points (+2.27%).
The markets have paused themselves at a crucial juncture. The Nifty has closed above the 50-DMA, which is presently at 24548. It is just a notch below the 100-DMA at 24707. This level also coincides with the 20-week MA placed at 24720 on the weekly timeframe. So, unless the Nifty closes well above 24720, we have to fairly take the zone of 24700-24750 as an immediate important resistance for the markets on a closing basis. For this technical rebound to extend, moving past and staying above 24750 would be necessary for the markets. On the other hand, the Nifty has rebounded off the 50-week MA; this level, placed at 23432, is the most crucial support for the Nifty if it has to keep the current primary trend intact.
Monday is likely to see a quiet start to the week; the levels of 24750 and 24900 are likely to act as resistance levels for the Nifty. The supports come in at 24450 and 24300 levels.
The weekly RSI is at 55.52; it is neutral and does not show any divergence against the price. The weekly MACD stays bearish and below its signal line. The PPO remains negative.
The pattern analysis of the weekly charts shows that the Nifty has completed a painful process of mean reversion. At one point, the Index was trading over 10% above the 50-week MA; the current retracement saw the Nifty testing this level a couple of weeks ago. The 50-week MA test at 23463 offered strong support, and the market rebounded from those levels. Presently, the Index has closed just below the 100-DMA and 20-week MA.
The up move after the Nifty took support at the 50-week MA has seen the Index rallying by over 1200 points. There is a possibility that Nifty may consolidate again for some time before it extends the current move. The banking and financial space is exhibiting strong relative strength. While this may continue, sectors like IT, Auto, Realty, etc., will likely show good momentum over the coming days. However, the Index is near its crucial resistance zone; this makes it necessary to guard profits at current levels. It is important that instead of chasing all up moves, the prudent thing to do would be to mindfully protect gains and stay invested in the stocks showing improvement in their relative strength. A cautious approach is advised for the coming week.
Sector Analysis for the coming week
In our look at Relative Rotation Graphs®, we compared various sectors against CNX500 (NIFTY 500 Index), which represents over 95% of the free float market cap of all the stocks listed.
Relative Rotation Graphs (RRG shows that the Nifty Bank Index has rolled inside the leading quadrant. It is expected to relatively outperform the broader markets along with the IT, Services Sector, and Financial Services Indices that are also present in this quadrant.
The Nifty Midcap 100 index is improving relative momentum while being placed inside the weakening quadrant. The Nifty Pharma Index is also inside the weakened quadrant.
The Nifty FMCG, Auto, Energy, Commodities, and Infrastructure Indices are in the lagging quadrant. The Nifty PSE Index is also in the lagging quadrant; however, it is improving its relative momentum against the broader markets.
The Nifty Media Index has rolled back inside the improving quadrant. Besides this, the Metal, Realty, and PSU Bank Indices are also placed inside the improving quadrant.
Important Note: RRG charts show the relative strength and momentum of a group of stocks. In the above Chart, they show relative performance against NIFTY500 Index (Broader Markets) and should not be used directly as buy or sell signals.
Milan Vaishnav, CMT, MSTA
Consulting Technical Analyst

