Top Posts
Navigating Earnings: Three Stocks, Three Different Stories
Unlock the Power of StockCharts’ NEW Market Summary...
Market Maker Manipulation; Oops, They Did It Again!
Rae Copper Project delivers further high-grade mineralisation with...
Murchison South Increases to 67koz Gold Across Two...
RUA GOLD Completes the Second Phase of Surface...
Fox streaming service to be called Fox One,...
Walgreens doubles down on prescription-filling robots to cut...
Falco Files Requested Documentation for the Horne 5 Project’s...
Nuvau Minerals Completes High Resolution Drone MAG Survey
  • Home
  • Investing
  • Stock
  • Economy
  • Editor’s Pick
Market Commandos
Stock

How to Trade Erratic Uptrends – An Example and Setup using IWM

by admin January 4, 2025
January 4, 2025

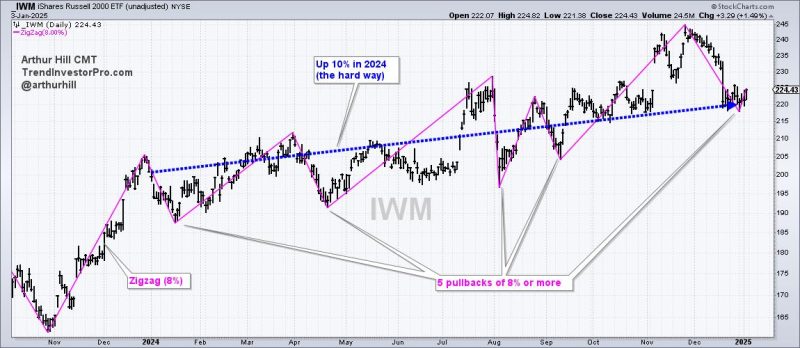
The Russell 2000 ETF managed a double-digit gain in 2024, but did it the hard way with several deep pullbacks. Pullbacks within uptrends are opportunities and we can find such opportunities using %B.

The chart below shows the Russell 2000 ETF (IWM) with the Zigzag(8) indicator. This indicator changes direction when there is a move greater than 8%, which means it ignores price moves that are less than 8%. I am showing this indicator to highlight five pullbacks of 8% or more in 2024. That’s a lot. In contrast, the S&P 500 SPDR (SPY) only experienced one 8+ percent pullback in early August.

Overall, IWM advanced 10% in 2024. That seems like a good year, but it was a “hard” 10% when we include the five 8+ percent pullbacks. This is simply the nature of small-cap stocks. They are less “trendy” than large-caps and have higher betas, making them more susceptible to wider fluctuations. Traders need to consider this when trading small-caps. As noted in Chart Trader this week, we see similar price action in the S&P 500 EW ETF (RSP) and S&P MidCap 400 SPDR (MDY).

Click here to take Chart Trader trial and get immediate access.

Buying upside breakouts is probably not the best strategy for trading IWM. Instead, traders should consider pullbacks and mean-reversion opportunities. We can identify such opportunities using Bollinger Bands (20,2) and %B (20,2). The middle line on the Bollinger Bands is the 20-day SMA and the bands are two standard deviations above and below. A close below the lower band means price fell two standard deviations and this creates an oversold condition.

Chartists can quantify oversold conditions using %B, which falls below 0 when the close is below the lower Bollinger Band. The blue lines on the chart above show %B dipping below 0 four times in 2024. Note that I would also only look for oversold conditions when price is above the 200-day SMA (long-term uptrend). When the bigger trend is up, a close below the lower Bollinger Band signals an oversold condition that can lead to a bounce.

December was a rough month for many stocks and ETFs. Even so, the weight of the evidence remains bullish for stocks and these pullbacks look like corrections within bigger uptrends. This week’s reports and videos focused on long-term breadth indicators, short-term oversold breadth, leading ETFs and a dozen ETFs with tradable pullbacks.

Click here to take a Chart Trader trial and get immediate access.

///////////////////////////////////////////////

previous post
Zodiac Gold Announces Closing of First Tranche of Non-Brokered Private Placement
next post
S&P 500 climbed 0.3%, and Nasdaq-100 futures jumped 0.7%

You may also like

Navigating Earnings: Three Stocks, Three Different Stories

May 13, 2025

Unlock the Power of StockCharts’ NEW Market Summary...

May 13, 2025

Market Maker Manipulation; Oops, They Did It Again!

May 13, 2025

Week Ahead: NIFTY Stays In Technically Challanging Environment;...

May 11, 2025

Recession Ahead? Sector Rotation Model Warns of Rising...

May 10, 2025

Where the Market Goes Next: Key Resistance Levels...

May 10, 2025

Investment Portfolio Feeling Stagnant? Transform Your Path Today

May 10, 2025

Don’t Buy Robinhood Stock… Until You See This...

May 9, 2025

Three Charts to Watch for an “All Clear”...

May 8, 2025

The Unpredictable Stock Market: How to Make Sense...

May 8, 2025

    Stay updated with the latest news, exclusive offers, and special promotions. Sign up now and be the first to know! As a member, you'll receive curated content, insider tips, and invitations to exclusive events. Don't miss out on being part of something special.


    By opting in you agree to receive emails from us and our affiliates. Your information is secure and your privacy is protected.

    Recent Posts

    • Navigating Earnings: Three Stocks, Three Different Stories

      May 13, 2025
    • Unlock the Power of StockCharts’ NEW Market Summary Dashboard | Walkthrough & Tips

      May 13, 2025
    • Market Maker Manipulation; Oops, They Did It Again!

      May 13, 2025
    • Rae Copper Project delivers further high-grade mineralisation with 63m @ 2.23% Copper

      May 13, 2025
    • Murchison South Increases to 67koz Gold Across Two Pits

      May 13, 2025
    • About us
    • Contact us
    • Privacy Policy
    • Terms & Conditions

    Copyright © 2024 MarketCommandos.com All Rights Reserved.

    Market Commandos
    • Investing
    • Stock
    • Economy
    • Editor’s Pick