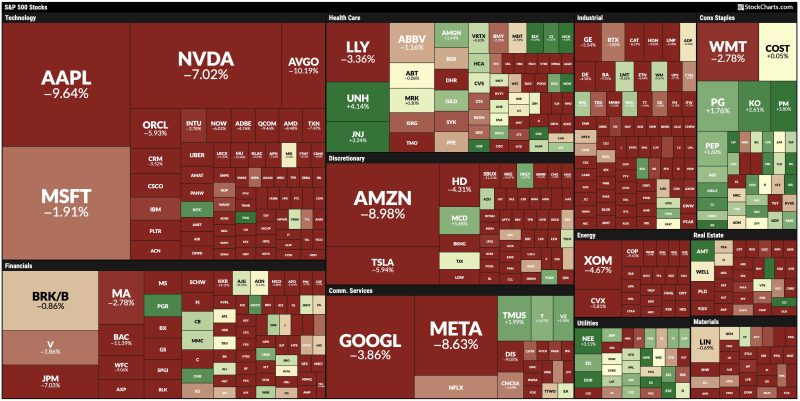
With the S&P 500 and Nasdaq dropping quickly after this week’s tariff announcements, investors are scrambling to identify areas of the market demonstrating strength despite broad market weakness. The good news is that I was able to easily find strong charts with improving relative strength using the StockCharts platform.
As much as it feels like “everything is down” after Wednesday’s news on increased tariffs on a vast number of products, a quick review of the S&P 500 MarketCarpet on Thursday afternoon provides a quick reminder that plenty of stocks were actually trading higher into the afternoon.
Let’s review two stocks and one ETF demonstrating strength in recent weeks. And if you’re looking for more potential ideas, perhaps review my Top Ten Charts to Watch for April 2025 with Grayson Roze!
Kroger Co. (KR)
When the economy is strong, and consumer confidence is high, we often see a surge in “things you want” such as travel and luxury goods. During periods of economic weakness, those Consumer Discretionary names will struggle relative to “things you need” like cleaning products, household goods, and beverages. So it’s not surprising that our first two charts are in the Consumer Staples sector!
Indeed, the chart of Kroger has a “long and strong” look to it, featuring a consistent pattern of higher highs and higher lows since the October 2024 breakout.
Two pullbacks in March saw Kroger achieve a higher low above the 50-day moving average, confirming that buyers are coming into “buy the dips” and push the stock to new highs. The most impressive feature of this chart is the steady uptrend in the relative strength. As long as that series remains trending higher, it means Kroger provides an opportunity to do better than our struggling benchmarks.
Keurig Dr Pepper Inc (KDP)
Back in October 2024, Keurig Dr Pepper saw a series of downside gaps on disappointing earnings results. I’ve highlighted these gaps with shaded areas so we can see how often these price ranges have come into play during subsequent price action.
We can see that KDP struggled to regain the lower price gap range late last year, with the 200-day moving average also serving as resistance during that period. Then in February we finally saw a break above the 200-day before KDP eventually found resistance at the upper price gap from last October. From late February through early April, Keurig Dr Pepper has basically traded between these two price zones, with the most recent upswing taking the stock back up to test the upper price gap range.
Similar to Kroger, I would say the most compelling piece of this chart is the improving relative strength. If most stocks are in primary uptrends, then perhaps KDP does not look nearly as impressive. But with Magnificent 7 stocks and other growth names pounding out clear distribution phases, the chart of Keurig Dr Pepper could provide an opportunity to outperform.
Utilities Select Sector SPDR Fund (XLU)
Now let’s consider utilities, a sector which is usually bucketed with other defensive groups yet has actually traded along with growth sectors at times over the last 12 months. The reason for this shift has been partly due to the incredible energy needs of artificial intelligence, cryptocurrency mining, and other enterprises requiring heavy computer power.
The price structure of the XLU is fairly neutral at the moment, with this ETF basically stuck in a trading range since the 4th quarter of 2024. But with most S&P 500 names trading below their 200-day moving averages, I’m immediately drawn to charts that remain above this long-term trend barometer. The XLU has actually successfully tested the 200-day moving average three times in 2025, all resulting in short-term rallies.
The question here is whether the XLU can gain enough momentum to push above a clear resistance level around $82. But even that does not actually come to pass, a chart remaining in a sideways trend could provide an easy way to ride out a period where the major benchmarks are losing value. And given the higher-than-average dividend yield along with decent price action, the utilities sector seems like it deserves a second look.
Both KR and KDP were featured in our Top Ten Charts to Watch for April 2025, which you can access below!
RR#6,
Dave
PS- Ready to upgrade your investment process? Check out my free behavioral investing course!
David Keller, CMT
President and Chief Strategist
Sierra Alpha Research LLC
Disclaimer: This blog is for educational purposes only and should not be construed as financial advice. The ideas and strategies should never be used without first assessing your own personal and financial situation, or without consulting a financial professional.
The author does not have a position in mentioned securities at the time of publication. Any opinions expressed herein are solely those of the author and do not in any way represent the views or opinions of any other person or entity.

